Speaker calibration
Why this matters more than it sounds
No speaker is equally loud at every frequency, and ultrasonic speakers are worse than most. The one used in the original experiments is about 7 dB quieter near 15 kHz than at its best frequencies.
That is a problem for any experiment comparing sounds, because an animal spending more time in one arm tells you nothing if that arm was simply louder. A frequency preference and a loudness difference look identical in the data.
Calibration removes the confound. The software knows the speaker's response, boosts each tone by the amount that frequency is attenuated, and the set comes out equally loud.
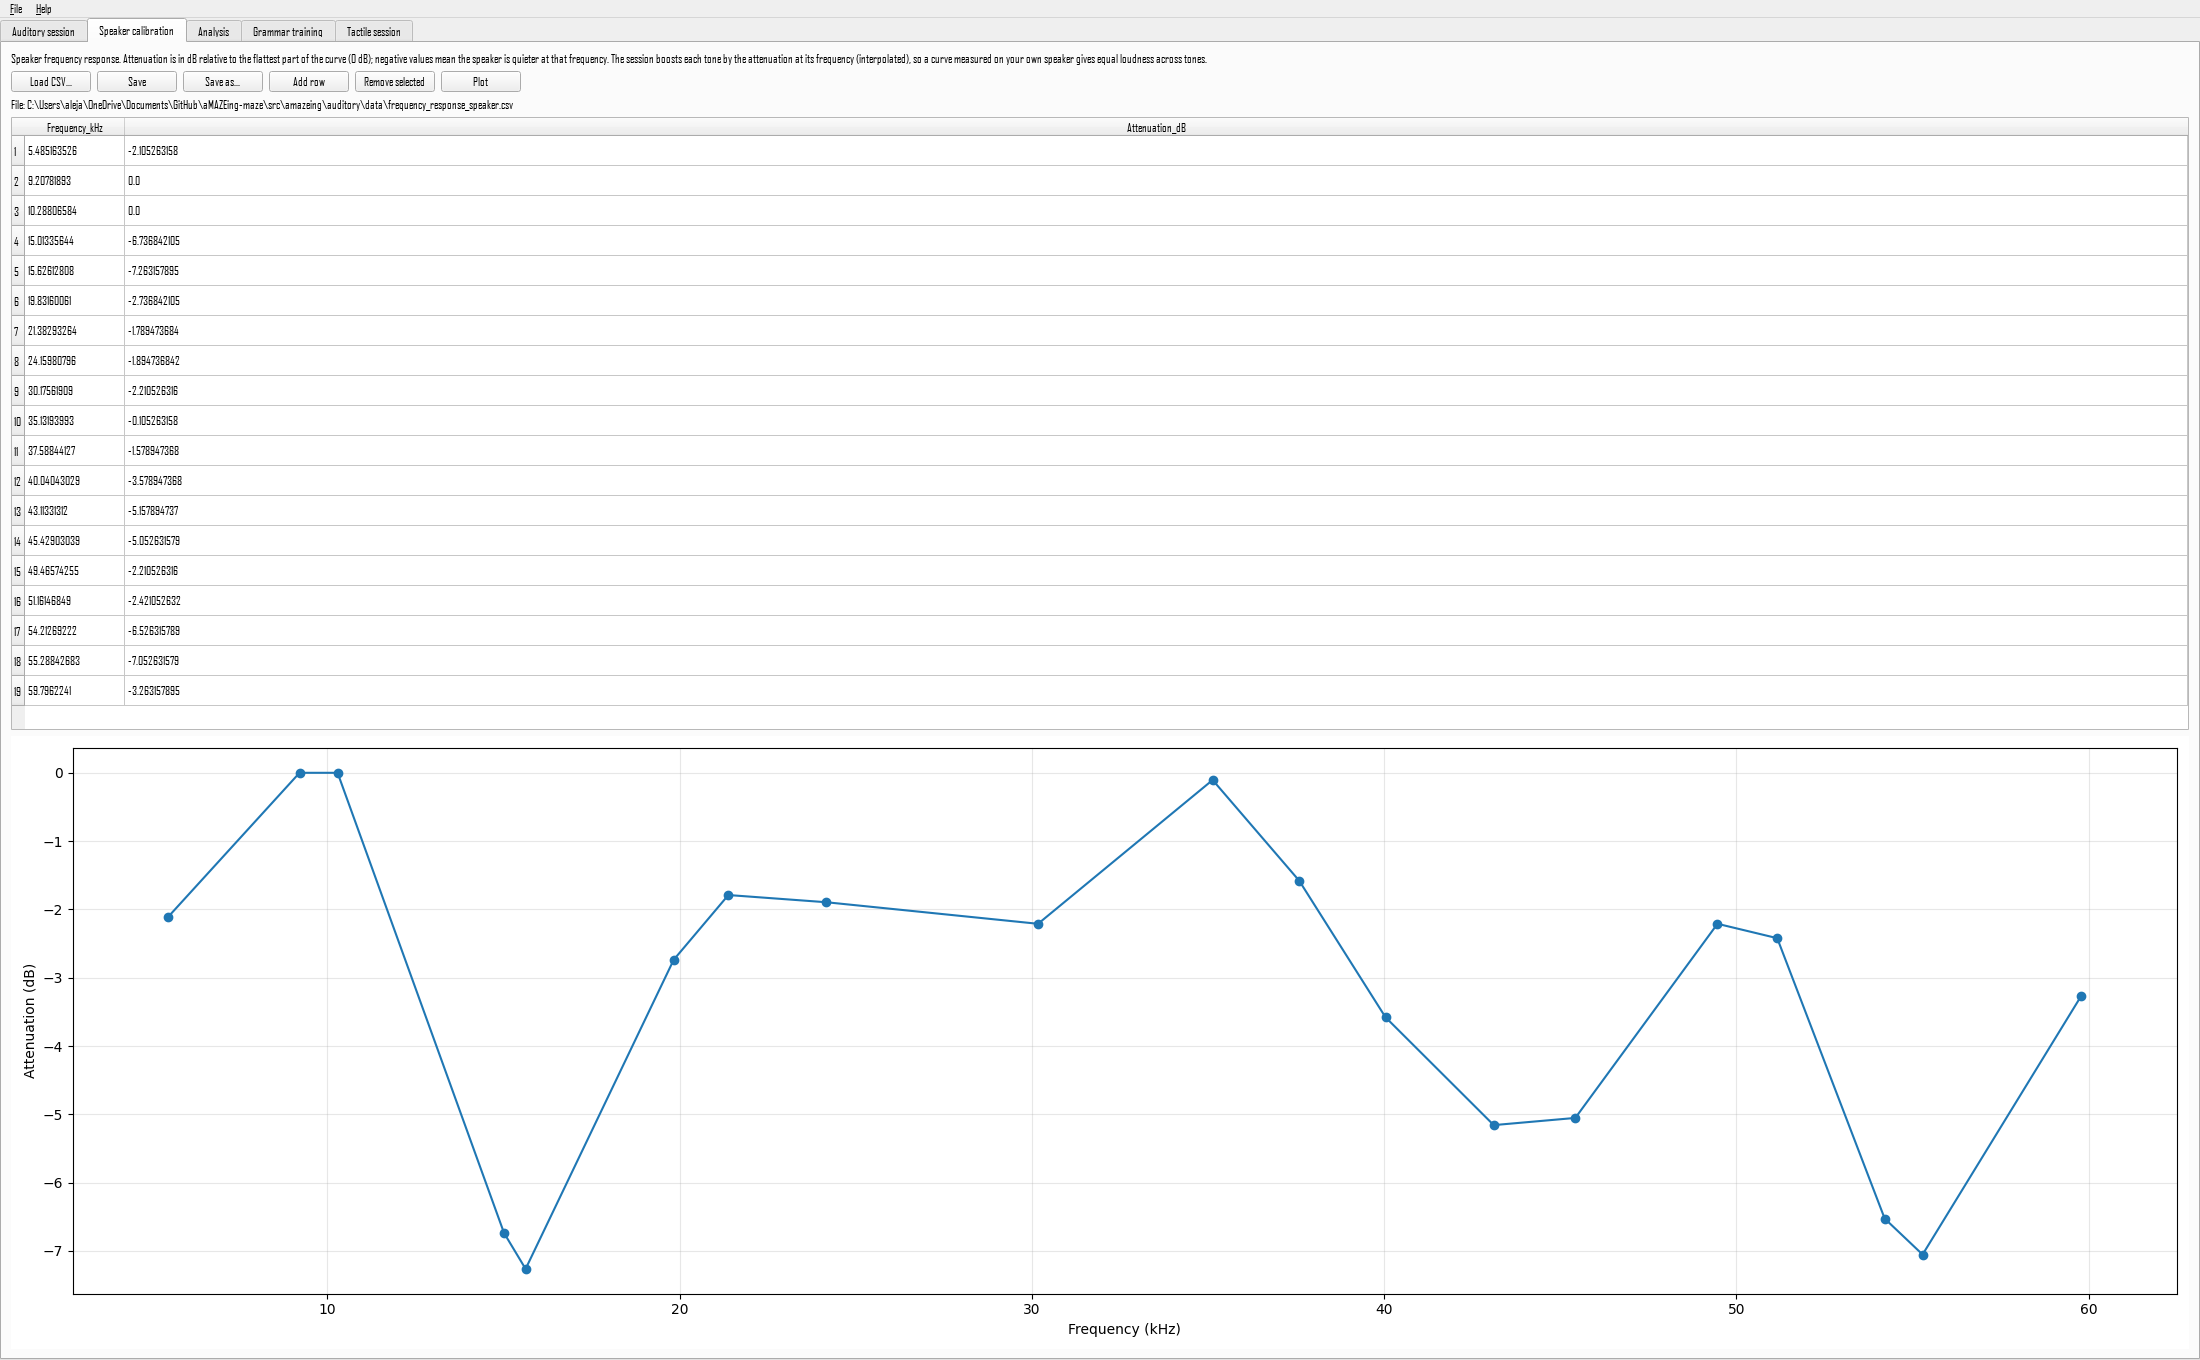
The file
A CSV with two columns:
Attenuation_dB is relative to the flattest part of the curve, which sits at 0. Negative means quieter. Values between the listed frequencies are interpolated, so you do not need a dense grid, but you do need enough points to follow the shape of the response.
The curve for the speaker used in the original work ships with the package and is loaded by default. It describes one particular speaker. If yours is a different model, or has aged, measure your own.
Getting a curve for your speaker
There are two routes, and the easy one is usually good enough.
From the manufacturer's data sheet
Most ultrasonic speakers publish a frequency response plot. Read points off it, or use a plot digitiser such as WebPlotDigitizer to extract them, and enter them in the table. This is how the shipped curve was produced.
By measuring it yourself
More work, more trustworthy, and it captures your room and speaker placement rather than an idealised bench measurement.
- Play a series of tones spanning your frequency range.
- Record them with an ultrasonic microphone, and read a sound level meter.
- For each tone, compute the amplitude in the recording and convert to dB.
- Enter frequency against attenuation relative to the loudest point.
The scripts in analysis/calibration/ do the signal-processing part: calibration_freq.py plays the tone series and fft_volume.py extracts per-tone amplitudes from the recording.
Editing the curve
Open the Speaker calibration tab, load your CSV or edit the one shown, and press Save as. The session's calibration path updates to the file you saved, so the next session uses it.
The plot updates as you edit, which makes a mistyped value obvious.
How the compensation is applied
For a single tone, the gain is the inverse of the attenuation at that frequency, so a tone in a 7 dB dip is played about 2.2 times louder.
For a set of tones played at a fixed nominal amplitude, such as the six tones of a grammar melody, boosting the quiet ones would push them past full scale and clip. Instead the whole set is scaled so that the most-boosted tone sits exactly at full scale and the rest are attenuated relative to it. The relative levels are correct, and nothing clips.
A consequence worth knowing
Because the set is scaled down rather than up, the overall level is that of the quietest frequency in the response. For the shipped curve this is about 6 dB below what an uncompensated set would produce. If you need a specific absolute level, measure at the animal's position and adjust the volume rather than assuming.
Sessions recorded before this existed
Grammar tones were not compensated in the original recordings. The grammar_apply_speaker_gain setting exists so those sessions can be reproduced exactly; leave it on for new work.